If you would like to understand more, or would like to see some other examples, or would like to explore how we might be able to help you plan and track a projects, then please contact us. Details are at the bottom of this page.
 Photo by Riccardo Annandale on Unsplash
For most lead scientists, research is a passion but accounting is not. In today's world where pure research for its own sake is rarely funded, lead scientists are unhappily expected to justify research projects with some notion of what the Return On Investment (ROI) might realistically be.
Chronogram provides, through a web-browser, not only the ability to assemble a realistic preliminary time plan, but also to "spin off" a realistic cash flow forecast giving you the critical part of a business plan, making your whole grant application far more likely to succeed.
It has been designed to be "as simple as possible, but no simpler" and is the indispensable tool that you will appreciate when you apply for funding for your next big research project.
 Photo from Stockcake
During the execution of your project, time so easily evaporates into thin air and you end up wondering what has been achieved exactly.
Chronogram allows easy time tracking, with just a few mouse clicks, so you can see exactly what happened and everyone can more easily plan their own time towards the project objectives.
Its controlled flexibility means you can adapt tasks as necessary and remove or include new tasks without disrupting the entire plan. Reviews become natural rather than painful.
The Chronogram chart gives easy visibility and becomes a strong justification for your decisions and the path you are taking at any time.
 Photo by National Cancer Institute on Unsplash
With real temporal and financial tracking the final Return On Investment (ROI) easily drops out from Chronogram's Financial products and the final project review easily exposes the successes and failures that form a fertile learning ground for the future.
Chronogram requires less of your valuable time than other planning and tracking tools because it avoids gimmicks and can be as complex or as simple as you need it to be - "As simple as possible, but no simpler."
 Part of a biological research program
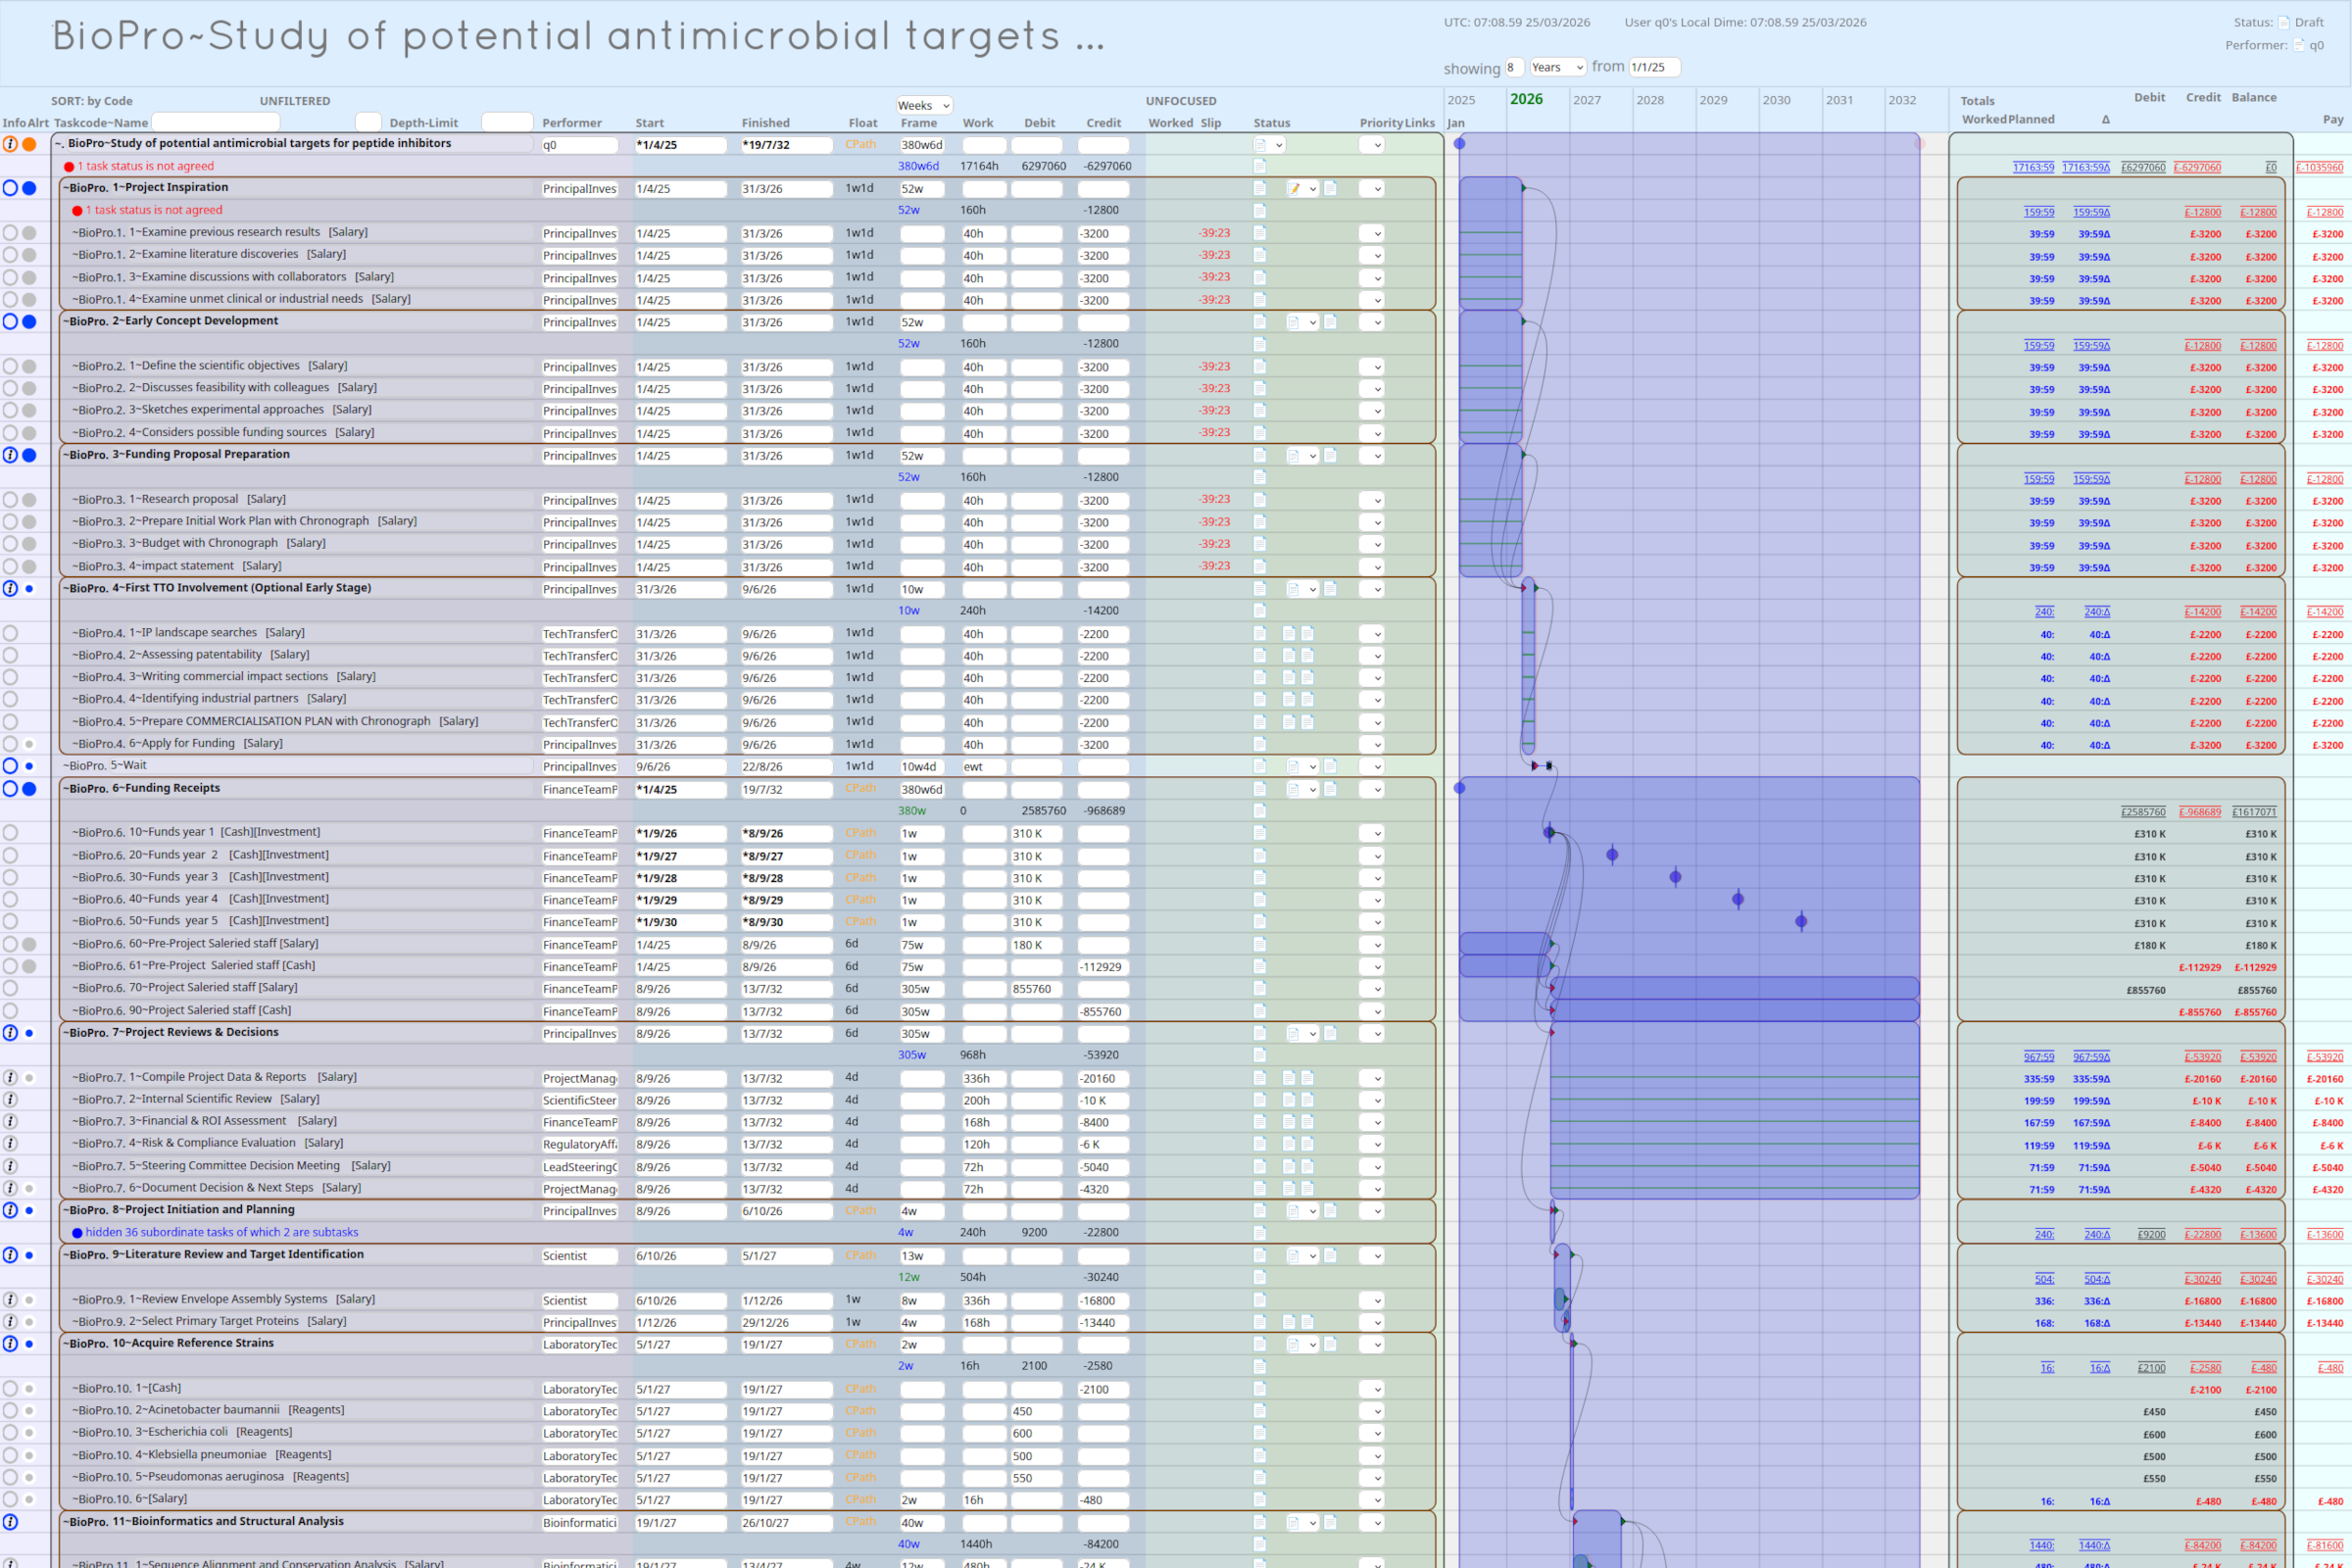
The image shows a part of the Chronogram chart for a study titled "Study of potential antimicrobial targets for peptide inhibitors". This is a fictional example with double entry style accounting. Note how on the right, the top number in the Balance column is £0 showing the accounts balance. ( Click here for a larger image in a separate tab.)
The principal investigator has allocated 160 hours over the time frame of one year for - Conception of the project, Project inspiration, Early concept development and Funding proposal preparation. When in the year these will be done is flexible and indeed the principal investigator may decide during this phase whether the project should go ahead or not.
If you would like to understand more, or would like to see some other examples related to your field, or would like to explore how we might be able to help you plan and track your own projects, then please contact us. Details are at the bottom of this page.